There's a moment, somewhere around day four of every sprint, that used to slow me down.
Someone would ask — a stakeholder, my manager, sometimes just the voice in my own head — "Are we on track? Is anyone overloaded? Are we going to land this?" JIRA held every piece of data I needed to answer that. But the answer itself lived scattered across boards, filters, and a dozen open tickets. Mid-sprint, when work moves fastest and people are most likely to be quietly over-committed, assembling that answer by hand was exactly when I had the least time to do it.
I didn't need more data. JIRA gave me plenty. I needed a single lens on top of it that could answer three questions instantly: Is each person's load realistic? Are we delivering what we committed to? And is reality matching the plan?
So I built one.
The question I cared about most: is anyone over-committed?
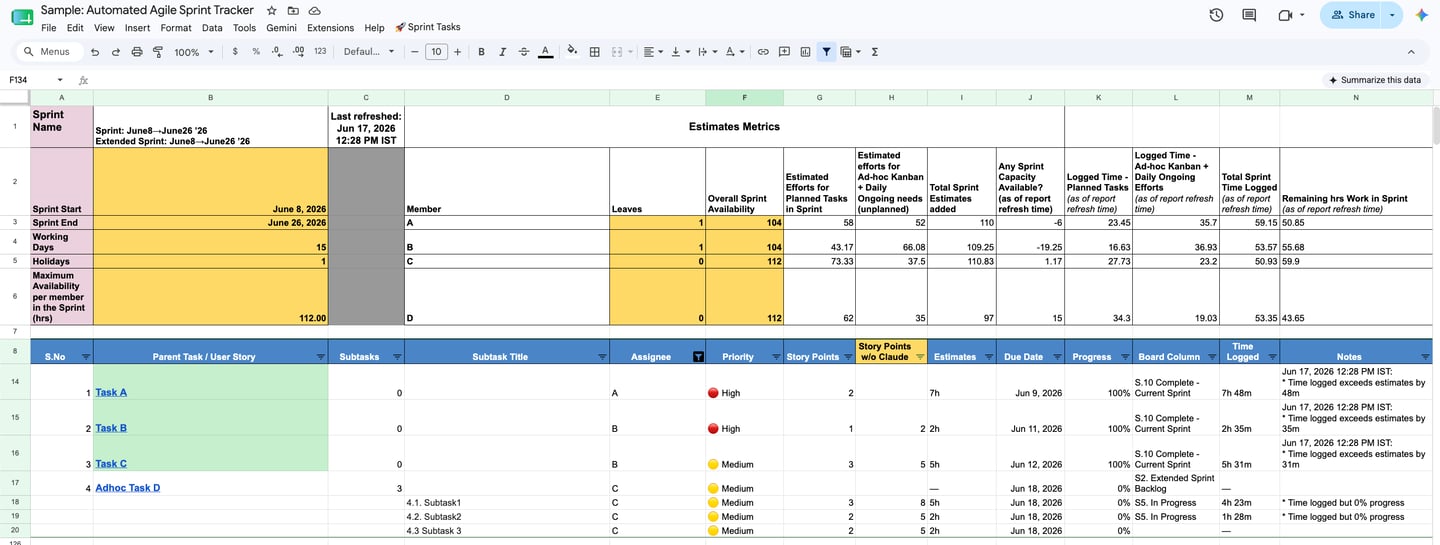
Most sprint trackers count tasks. The one I built starts somewhere more useful — with people and hours.
For every sprint, it models real capacity from the ground up: sprint start and end, working days, holidays, and the maximum available hours per team member. Then, for each person, it lays their actual commitments against that ceiling — planned work, plus the ad-hoc and ongoing work that always creeps in — and tells me, in plain numbers, whether they have capacity left or whether they're already over the line.
When someone is over-allocated, it shows up red and negative. Not at sprint review, when it's too late — live, while I can still rebalance. That single view has saved me from the most common and most avoidable sprint failure there is: quietly loading one person past the point they can deliver, and only finding out when they miss.
This is resource management made visible. It turns "I think the team's a bit stretched" into "B is nineteen hours over capacity, and here's exactly what's causing it."
The second question: planned versus what got pulled in
A sprint almost never ends as the shape it began. Urgent client work, an infra issue, a late-surfacing dependency — it all arrives mid-sprint and quietly reshapes the plan.
So the tracker separates effort into two streams from the start: estimated effort for planned work, and estimated effort for ad-hoc and ongoing work that wasn't in the original commitment. Both measured in hours, per person and across the sprint.
That separation is the difference between a fair sprint story and an unfair one. Instead of "we didn't finish everything," I can say: "We delivered all planned work and absorbed this much unplanned effort on top of it." Once you can see that unplanned number sprint after sprint, you can finally have the right conversation with stakeholders about how much firefighting is leaking into delivery — and do something about it.
It's also where the two-rhythm reality of how I work shows up in the data itself: Scrum for the planned stream, Kanban for the ad-hoc and ongoing stream, tracked side by side rather than tangled together.
The third question: is reality matching the plan?
This is where the tracker stops being a planning tool and becomes an early-warning system.
It pulls logged time alongside estimates, and surfaces the mismatches that quietly predict trouble:
Time logged exceeds the estimate — the work was under-scoped, and I should know now, not at review.
Time logged but zero progress — effort going in with nothing coming out. This is often the earliest visible sign of someone stuck, blocked, or heading down the wrong path. It's the flag I value most, because it catches problems while there's still time to help.
Remaining work in the sprint — a live read on what's genuinely left, not what the board optimistically implies.
These aren't numbers I have to go hunting for. The tracker writes them into a notes column automatically, in plain language, so the exceptions come to me.
A small honesty check I built in: estimation, with and without AI
One column on the tracker quietly does something I'm a little proud of.
I use AI to assist with story point estimation — but I never wanted to lose sight of whether that assistance was actually right. So the tracker keeps two views: the points as estimated with AI help, and the points without it. Holding the two side by side keeps the AI honest. It's a guardrail, not a crutch — AI speeds the estimation up, but I can always see what it changed and sanity-check it against the team's own judgment.
That, in a single column, is my whole philosophy on AI in delivery: use it to move faster, but never let it move unwatched.
The build: four simple layers, all free
I'm a project manager, not a platform engineer, and I had no interest in maintaining something fragile. So I kept it to four layers, each doing one job:
JIRA stays the source of truth — that's where the work lives. I only needed to read from it.
Google Apps Script does the fetching — it calls JIRA's API on a schedule and pulls the active sprint automatically. No button, no manual export; it just stays current.
Google Sheets is the engine — every issue lands as a structured row, and the sheet does the real work: capacity maths, planned-vs-unplanned effort, logged-vs-estimated comparisons, and the compliance flags.
A clean, readable view sits on top — colour-coded, with over-allocation and exceptions surfaced to where I can't miss them. Five seconds to open and know where the sprint stands.
The detail that keeps it trustworthy: subtasks roll up to their parents properly. JIRA often hands subtasks back detached, which can make a story look done while its subtasks are still open. Reassembling that relationship keeps the completion picture honest — and honesty is the only thing that makes a tracker worth opening.
Why this approach works anywhere
I built it for JIRA, but nothing about the idea is JIRA-specific. Strip it back and the pattern is simply:
A tool's API → a scheduled script → a structured sheet → a readable view.
Point it at Teamwork, Azure DevOps, or whatever your team lives in, and the same four layers hold. The pieces are free, the upkeep is near-zero once it's running, and because you built it, it shows you exactly what you need to see — capacity, effort, reality — instead of what an off-the-shelf report decided to show.
But the tooling was never really the point. The point was walking into every standup already knowing the answer to the questions that matter: Is my team's load realistic? Are we delivering what we promised? Is reality matching the plan? — and having the time to act on the answer, because something had been watching the sprint move all along.
I've kept this to the thinking and the approach rather than the line-by-line build. If you'd like to set up something similar on your own JIRA or another tool and want to go deeper, I'm always happy to walk through it. [Let's talk →]
Building a Live Sprint Tracker on Top of JIRA — Capacity, Effort, and Reality in One View